Project MotivationHaving an advanced degree has become a necessity for securing a job in many fields. However, it is difficult for applicants to predict their likelihood of being accepted to these academic programs. Applying to graduate school can cost students thousands of dollars in fees that may not always result in a return on investment. We want to help prospective students estimate the likelihood that they will be accepted to graduate programs in order to help students plan the number of applications to send out given their current academic standing.
Training and TestingWe scraped data from GradCafe.com using a Python script. The numeric attributes are Student GPA, Student GRE Quantitative Score, Student GRE Verbal Score, and Student GRE Writing Score. Moreover, we consider the rank of the 16 schools with the most observations as a numeric attribute. The nominal attributes are Student Residential Status (A: American; U: International, with US degree; I: International, without US degree), Graduate Program Type (PhD, Masters), School Name, Program Name and Result (Rejected/Accepted).
We removed observations that did not have GRE scores and were left with 10571 observations out of an initial 22582 observations. We then converted GRE scores on the 200 to 700 scale to scores on the 130 to 170 scale (effective August 1, 2011). We also made the school and program names consistent as sometimes a school was referred to by different names (e.g. MIT and Massachusetts Institute of Technology), or a program name contained typographical errors. For our initial training we marked unknown values as such and replaced unknown numeric values with the average of the attribute for the data set. The unknown values for the residential status remained ‘?’. In order to create training and test data sets, we randomized rows in the spreadsheet by creating a column of random numbers and sorting on this column. We used the top 70% of the observations for training, and the remaining 30% for testing. We used an online tool to convert the .csv file into an .arff file. We classified using Weka. Solution and Key ResultsWe decided to explore the following two settings:
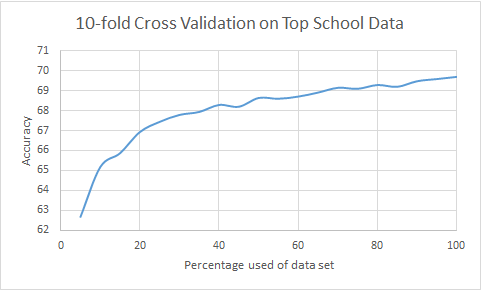
Learning curve for the top school data set, where we used 10-fold cross validation on the combined training and test sets. The underlying model is RotationForest.
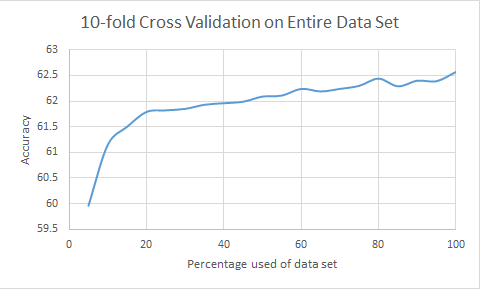
Learning curve for the entire data set, where we used 10-fold cross validation on the combined training and test sets. The underlying model is RotationForest.
Like what you see? Download the final report (PDF) below or try the model online and predict whether you will be accepted to a graduate engineering program.
|
